|
⇤ ← Revision 1 as of 2012-01-20 20:53:22
Size: 986
Comment:
|
← Revision 2 as of 2012-01-20 20:54:25 ⇥
Size: 1006
Comment:
|
| Deletions are marked like this. | Additions are marked like this. |
| Line 7: | Line 7: |
| ||<-3 style="text-align: center;"> '''Dopamine levels (nM)''' || || '''Animal ID''' || '''Presong exposure''' || '''During song exposure''' || || y33 || 35 || 37 || || y34 || 22 || 30 || || y35 || 25 || 27 || || y36 || 23 || 29 || || y37 || 31 || 35 || || y38 || 20 || 22 || || Mean || 26.0 || 30.0 || || SEM || 2.4 || 2.2 || |
||<-3 style="text-align: center;"> '''Dopamine levels (nM)''' || || '''Animal ID''' || '''Presong exposure''' || '''During song exposure''' || || y33 || 35 || 37 || || y34 || 22 || 30 || || y35 || 25 || 27 || || y36 || 23 || 29 || || y37 || 31 || 35 || || y38 || 20 || 22 || || Mean || 26.0 || 30.0 || || SEM || 2.4 || 2.2 || |
Practice Problem - Answer/Results
Effect of Early Song Exposure on DA Release within the Avian Basal Ganglia
- First, calculate the group means/SEM so you can get a general feel for the data.
Dopamine levels (nM)
Animal ID
Presong exposure
During song exposure
y33
35
37
y34
22
30
y35
25
27
y36
23
29
y37
31
35
y38
20
22
Mean
26.0
30.0
SEM
2.4
2.2
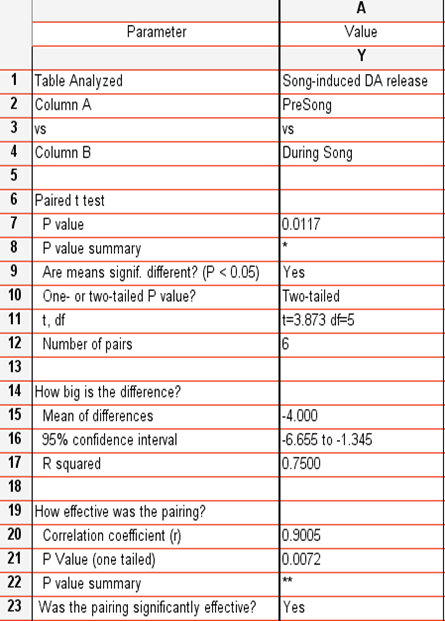
- Next, enter the data into Prism and run the appropriate analysis.
- NOTE: You should use PAIRED t-test for these data (unpaired yields p=.246)
- Finally, construct a summary statement that accurately reflects the results obtained. For example:
Compared to baseline (before song exposure), DA levels were significantly elevated after song exposure (t=3.873, df=5, p<.02).

