|
⇤ ← Revision 1 as of 2012-01-20 21:57:16
Size: 90
Comment:
|
← Revision 2 as of 2012-01-20 22:07:56 ⇥
Size: 2184
Comment:
|
| Deletions are marked like this. | Additions are marked like this. |
| Line 4: | Line 4: |
* First, calculate the group means/SEM so you can get a general feel for the data. ||<-7> '''Avg''' || || || Predeaf || Deaf7 || Deaf14 || Deaf21 || Deaf28 || Deaf35 || || Control || 93.43 || 90.86 || 88.38 || 81.09 || 74.09 || 63.93 || || Lesioned || 94.52 || 93.87 || 91.80 || 91.76 || 92.71 || 92.06 || ||<-7> '''SEM''' || || || Predeaf || Deaf7 || Deaf14 || Deaf21 || Deaf28 || Deaf35 || || Control || 1.12 || 1.57 || 2.30 || 5.22 || 4.92 || 5.58 || || Lesioned || 0.81 || 0.33 || 1.77 || 1.58 || 0.82 || 1.58 || * Next, enter the data into Prism and run the appropriate analysis (2 way ANOVA mixed design: Group is independent factor and days postdeaf is repeated measures), followed by posthoc tests. Be sure to think carefully about what posthoc tests you want to make. {{attachment:practice4-figure1.png}} * Finally, construct a summary statement that accurately reflects the results obtained. For example: ''2-way ANOVA revealed a significant main effect of lesion (F (1,45) = 12.85, p<.01), time (F (5,45) = 22.82, p<.0001) and a significant interaction F (5,45) = 18.03, p<.0001). Posthoc t-tests revealed that the degradation of song acoustic structure that is evident in unlesioned deafened animals did not occur in the lMAN lesioned group. Similarity scores of unlesioned animals were significantly lower than predeaf scores by 21 days (t=4.698, p<.001), and they continued to decline thereafter. In contrast, the scores of lesioned animals did not change significantly after deafening. The gradual deterioration of song acoustic structure that was evident only in the unlesioned group resulted in scores that were significantly lower in control as compared to lesioned animals by 35 days after deafening (t=3.804, p<.05).'' * Note that the results from Prism shown above only give posthoc results for the effect of time (because the data table was set up with time represented in columns). To get the posthoc results for the effect of treatment group, you need to create a new data table with group represented in the columns. |
Practice Problem
Effect of LMAN lesion on behavioral change after deafening
- First, calculate the group means/SEM so you can get a general feel for the data.
Avg
Predeaf
Deaf7
Deaf14
Deaf21
Deaf28
Deaf35
Control
93.43
90.86
88.38
81.09
74.09
63.93
Lesioned
94.52
93.87
91.80
91.76
92.71
92.06
SEM
Predeaf
Deaf7
Deaf14
Deaf21
Deaf28
Deaf35
Control
1.12
1.57
2.30
5.22
4.92
5.58
Lesioned
0.81
0.33
1.77
1.58
0.82
1.58
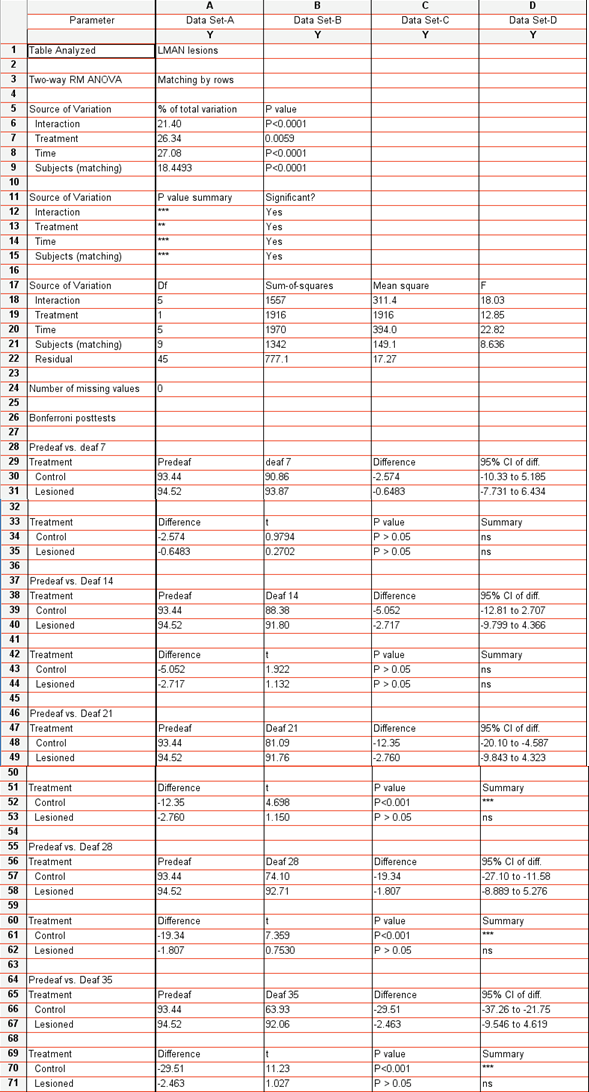
- Next, enter the data into Prism and run the appropriate analysis (2 way ANOVA mixed design: Group is independent factor and days postdeaf is repeated measures), followed by posthoc tests. Be sure to think carefully about what posthoc tests you want to make.

- Finally, construct a summary statement that accurately reflects the results obtained. For example:
2-way ANOVA revealed a significant main effect of lesion (F (1,45) = 12.85, p<.01), time (F (5,45) = 22.82, p<.0001) and a significant interaction F (5,45) = 18.03, p<.0001). Posthoc t-tests revealed that the degradation of song acoustic structure that is evident in unlesioned deafened animals did not occur in the lMAN lesioned group. Similarity scores of unlesioned animals were significantly lower than predeaf scores by 21 days (t=4.698, p<.001), and they continued to decline thereafter. In contrast, the scores of lesioned animals did not change significantly after deafening. The gradual deterioration of song acoustic structure that was evident only in the unlesioned group resulted in scores that were significantly lower in control as compared to lesioned animals by 35 days after deafening (t=3.804, p<.05).
- Note that the results from Prism shown above only give posthoc results for the effect of time (because the data table was set up with time represented in columns). To get the posthoc results for the effect of treatment group, you need to create a new data table with group represented in the columns.
