Contents
Important Login Info
JetBrains (for CLion)
( This license will be valid until June 30, 2021 )
email: aplab@ur.rochester.edu
- username: aplabrochester
- password: Qebgcsft2020
- License ID: 9GEWLSQANP
Many useful resources can be found on our share drive: \\opus.cvs.rochester.edu\aplab\
Overleaf
email: aplab@ur.rochester.edu
- password: Qebgcsft2020
UR Email Login
email: aplab@ur.rochester.edu
- password: Winter2020!
Gmail Login
email: aplab.boston@gmail.com
- password: qebgcsft2007
- recovery phone 6175953785 (Martina)
CorelDraw Login
Shows serial numbers for purchased products. Enables de-activating current installations.
The lab purchased Home & Student Suite in 2018 - there should be three available licenses (1 for MP, 1 on shared lab PC as of Dec 2020).
- coreldraw.com
email: aplab@ur.rochester.edu
- password: Qebgcsft2022
Installation Files: on opus/softwares
University IT Computing Resources
https://tech.rochester.edu/virtual-desktop-tutorials/
NSF GRFP
Great resources for NSF Graduate Research Fellowship https://www.alexhunterlang.com/nsf-fellowship
Brownian Motion
This file from MA gives some information on how to estimate parameters of Brownian motion: Random_walk_and_diffusion_coefficient.pdf
In writing Aytekin et al. 2014, concerns emerged on how the diffusion coefficients were estimated. There was a factor of 2 discrepancy with the estimate of Kuang et al. 2012. The following document from MR personal notes explain the issue and how the discrepancy was solved. It also contains some pointers at how to calculate the diffusion coefficient: MR_Notes_12-31-13.pdf
A comparison between the diffusion coefficient calculated based on the displacement squared and based on the area: DiffusionCoefficient.pdf (Martina).
Estimating Retinal Velocity
It may appear counter-intuitive but the non-coincidence of the center of the retina with the optical nodal point amplifies retinal image motion: RetinalAmplification.pdf. Careful, however, because this effect cancels out when this motion is brought back into stimulus coordinates (degrees of visual angle).
Eye Motion Examples
Hanoi Tower Video: https://drive.google.com/file/d/1L1HD5T18BtgHoUqUdmMEbgmEdR1dahKE/view?usp=sharing
Estimating Power Spectrum

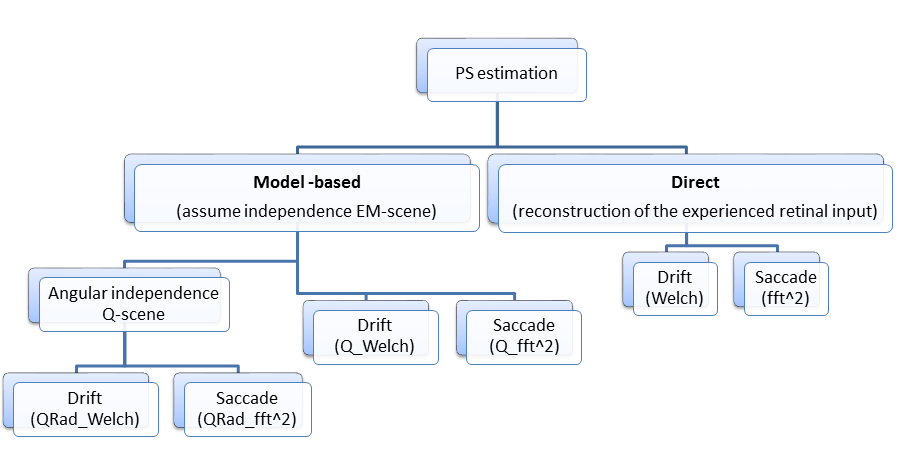
Frequency analysis of the retinal input at the time of eye movements shows how the temporal modulations resulting from different types of eye movements can alter the distribution of spatial power on the retina. The power spectrum can be estimated in direct and indirect(model-based) methods.
Direct Method
In the direct method, a movie of the retinal stimulus is created by translating the image following the recorded eye trajectory, so that each frame is centered at the current gaze location. The power spectra of these movies can be estimated by means of Welch algorithm for drifts and fft^2 algorithm for microsaccades. The matlab codes "Welch_SingleTrace" and "fft2_SingleTrace" located at https://gitlab.com/aplabBU/Modeling/tree/master/PowerSpectrumEstimation are developed to do the estimation using the direct method.
Model-Based Method
To achieve high-resolution estimations of spectral densities, we have developed a model (see Supplementary Information in Kuang et al., 2012 and JV's notes on drift and models: Eyemov_spec_v6.pdf), which links the power spectrum of the retinal input, S, to the characteristics of eye movements and the spectral distribution of the external scene I:
S (k,w) = I(k) * Q(k,w)
where k and w represent spatial and temporal frequencies, respectively, and Q(k,w) is the Fourier Transform of the displacement probability of the stimulus on the retina q(x,t), i.e., the probability that the eye moved by x in an interval t. This model relies on the assumptions that:
the external stimulus possesses spatially homogenous statistics, and
the fixational motion of the retinal image is statistically independent from the external stimulus.
The assumption of independence may not hold in restricted regions of the visual field, e.g., in the fovea, where stimulus-driven movements may yield statistical dependencies between retinal motion and the image. It is, however, a very plausible assumption when considered across the entire visual field, as the estimation of the power spectrum entails.
The matlab codes "QRad_Welch_SingleTrace" and "QRad_fft2_SingleTrace" can be found on gitlab: https://gitlab.com/aplabBU/Modeling/tree/master/PowerSpectrumEstimation are developed to do the estimation using the model-based method.
Notes
Some math on how we got to the computationally simplified methods for estimating spectra: 1DPowerEstimation_July31-12.pdf_withNotes.pdf
A comment on why theoretical and Welch spectral estimations may differ: Comparing_WelchTheory_BM.pdf
Janis's Notes on Drift and Brownian Models of Drift: link to overleaf document
Downloads
These are outdated with the release of eyeris in 2020
The latest version of EMAT:
EMAT-2.0.0.1.zip
The latest version of the EyeRIS Toolbox:
EyeRIS2-2.3.0.0-toolbox.zip
