Working with VassarStats: Website for Statistical Computation
VssaarStats is a web-based stats toolbox created by Richard Lowry of the Vassar College. The Vassar Stats website provides an intuitive point-and-click web interface for conducting statistical analyses. As long as there is a browser program on your computer or any mobile device, you can analyze data with Vassar Stats. However, this also means that you'll be unable to save data and any analysis results. In addition, there are no data manipulation functions, so you will need to make sure that the data are in the correct format.
Basics: (t-test example)
Basics
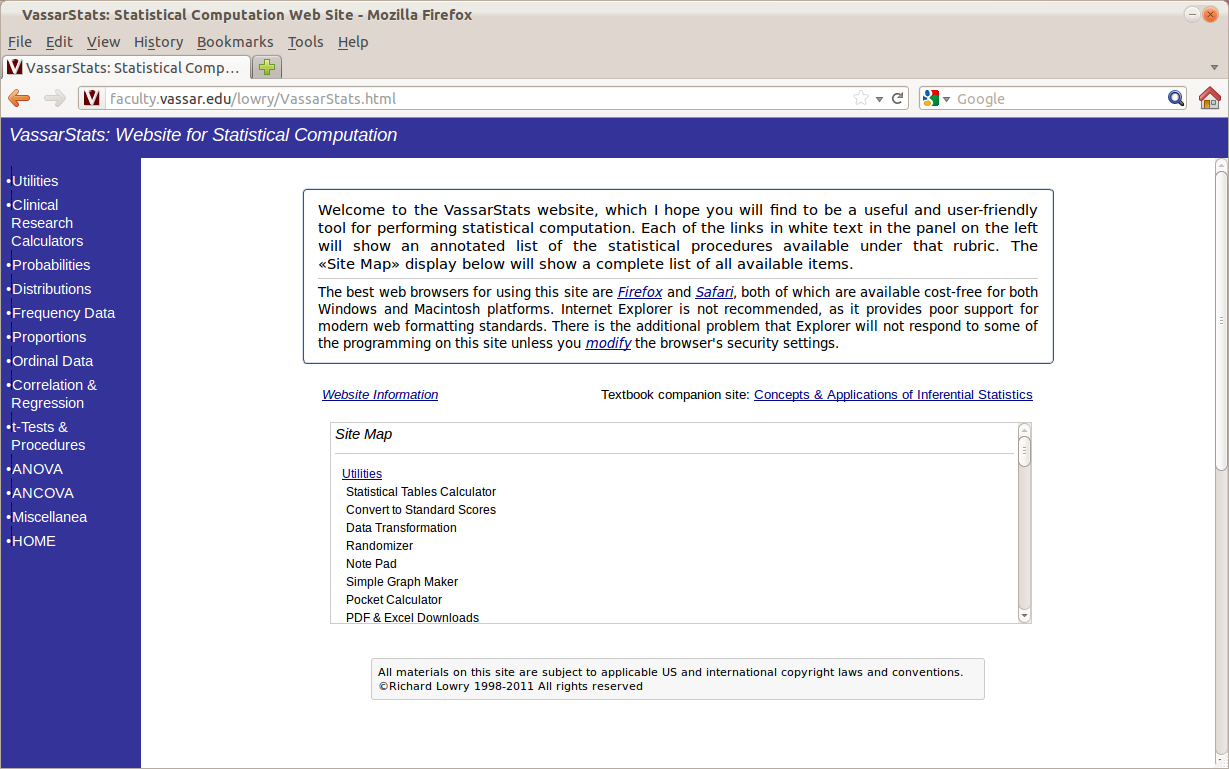
Open your browser and go to http://faculty.vassar.edu/lowry/VassarStats.html. Here's what you should be able to see:

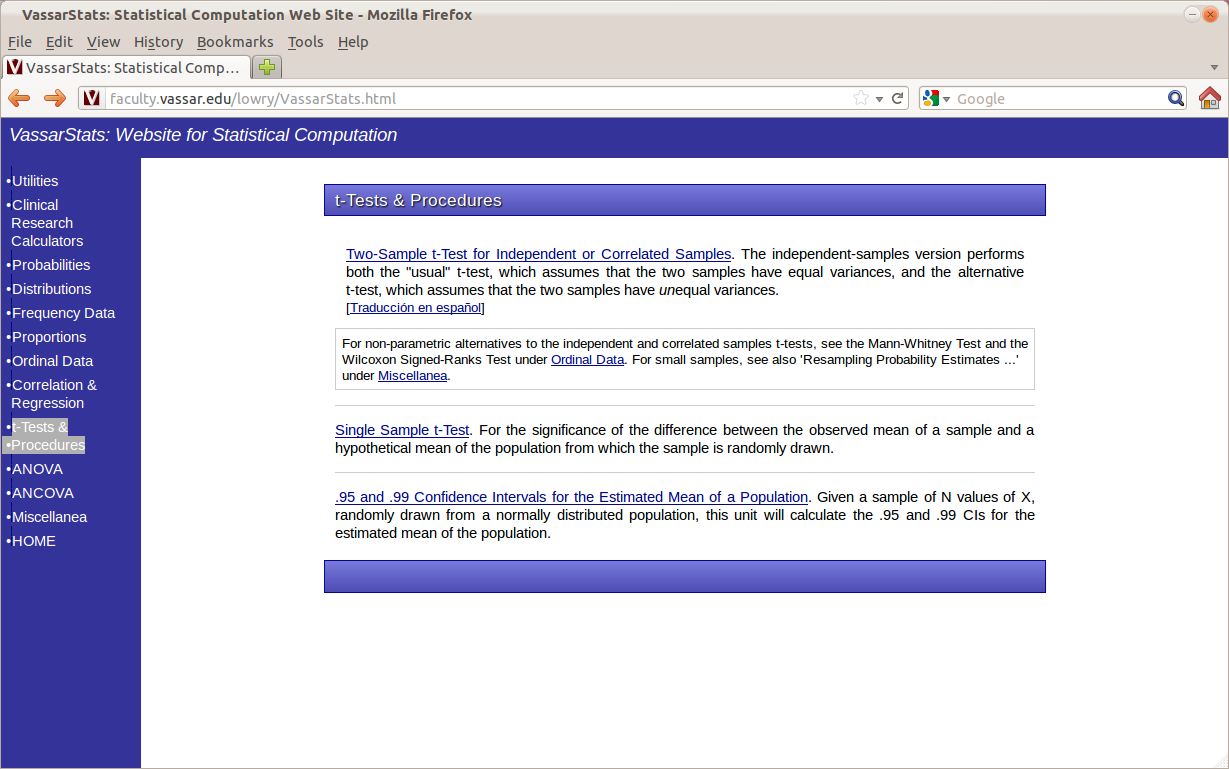
The left panel of the website lists the statistical tests that you can do with Vassar Stats. Click on "t-Tests & Procedures". Then choose the type of t-test you wish to conduct. For the our blood pressure example, we choose the first option "Two-Sample t-Test for Independent or Correlated Samples":

Data Table Setup
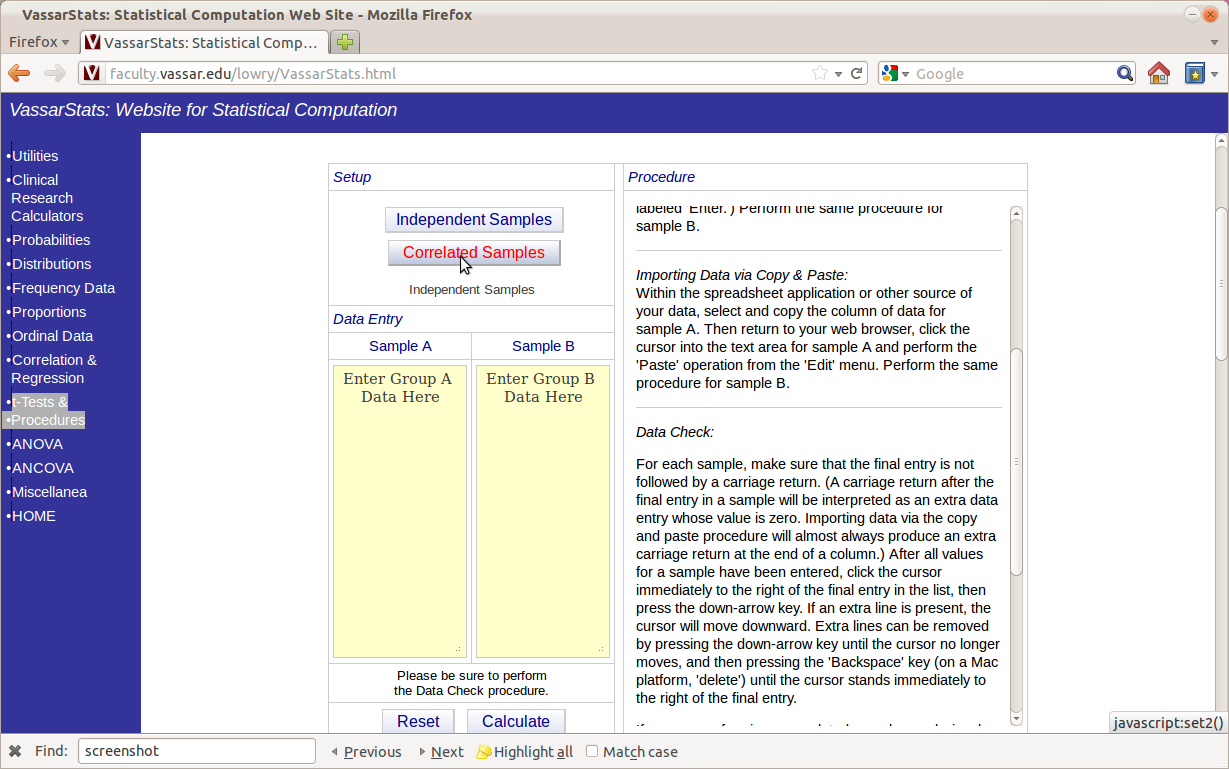
On the next screen, enter the blood pressure values from the first group into the textfield labeled "Sample A". Enter only one value per line. Enter the blood pressure values from the second group into "Sample B".

We also need to choose the type of a t-test we want to conduct. The blood pressure example uses a repeated design, in which measures of interest are taken from the same group of subjects under two different conditions. Therefore, click on the button above the data entry forms that says "Correlated Samples" (correlated means repeated or paired). The screenshot above illustrates the procedure.
Please also read the "Procedure" section on the website if this is the first time you have used Vassar Stats.
Results
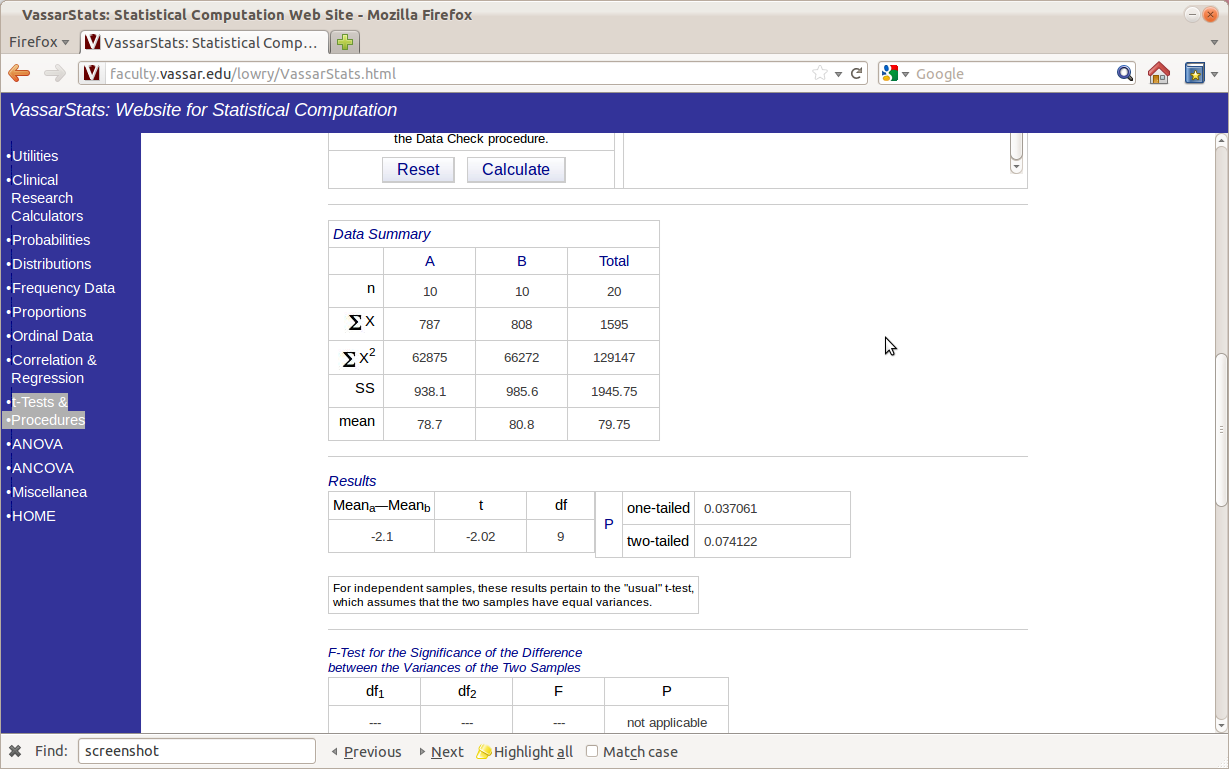
Once the data are entered and the appropriate type of t-test is selected, click the "Calculate" button. Then scroll down to the bottom half of the web page to see the results. For a paired t-test, the only relevant results are displayed in the first two tables: "Data Summary" and "Results".

The Data Summary section lists the mean, sum, sum of squares, and standard deviation of each sample. Such information is often helpful in evaluating the absolute difference between the two samples. The Results section lists the difference in means (Mean_a - Mean_b), the t-obtained statistic, the degrees of freedom, and the exact p values of the test. Note that Vassar stats computes two p values for you: a one-tailed p value and a two-tailed p value. Choose the two-tailed p value unless you have a very good reason to believe that the correct t-test should be one-tailed. In this example, the p value is between 0.05 and 0.1, indicating a marginally significant result (see the t-test section for more details).
Other Tests
Conducting other statistical tests with VassarStats is just as straightfoward as the above t-test example. Use the left navigation bar on the Vassar Stats website to find the test you wish to conduct, and then follow on-screen instructions. Vassar Stats supports all the statistical tests covered in this wiki.
