Practice Problem - Answers/Results
Effect of Deafening on Adult Song Structure
- First, calculate the group means/SEM so you can get a general feel for the data.
Animal ID
Predeaf
Deaf7
Deaf14
Deaf21
Deaf28
Deaf35
r54a
79.0
73.9
73.0
71.1
66.5
62.1
r55a
99.5
94.2
89.7
83.6
72.6
65.2
r58a
92.3
92.7
93.3
87.7
79.7
66.2
r62a
90.3
91.6
92.8
90.1
85.9
80.6
r64a
96.4
90.8
87.8
82.1
75.8
61.9
r78a
87.2
87.0
85.0
80.1
80.2
80.0
r77a
82.0
81.0
75.0
78.0
76.7
76.2
mean
89.5
87.3
85.2
81.8
76.8
70.3
SEM
2.8
2.8
3.1
2.4
2.3
3.1
- Next, enter the data into Prism and run the appropriate analysis.
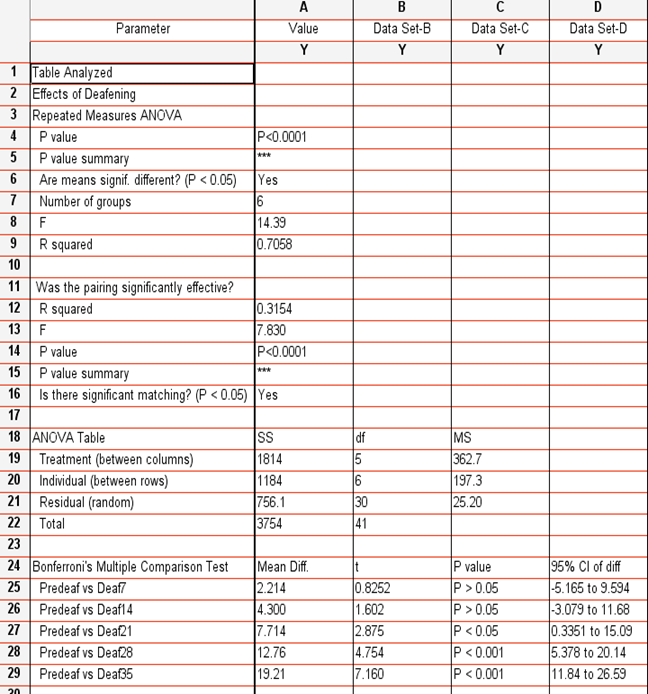
- NOTE: You should use a repeated ANOVA (independent ANOVA yields p=.0002; predeaf vs d21 ns)

- Finally, construct a summary statement that accurately reflects the results obtained. For example:
Repeated measures ANOVA revealed a significant main effect of deafening on song acoustic structure (F (5,30) = 14.39, p<.0001. Similarity scores were significantly lower by 21 days after deafening than those before deafening (t=2.875, p<.05), having declined by an average of 8 + 2%. Songs continued to degrade thereafter, and by d35 the similarity scores were 21 + 5% lower than before deafening (t=7.16, p<.001).
- Note that in the text above, we provide a supplemental measure(% song degradation) to help the reader appreciate the effect of deafening. Check the formula used in the data set below to see how we calculated % degradation.
% decline
Predeaf
Deaf7
Deaf14
Deaf21
Deaf28
Deaf35
r54a
0%
6%
8%
10%
16%
21%
r55a
0%
5%
10%
16%
27%
34%
r58a
0%
0%
-1%
5%
14%
28%
r62a
0%
-1%
-3%
0%
5%
11%
r64a
0%
6%
9%
15%
21%
36%
r78a
0%
0%
3%
8%
8%
8%
r77a
0%
1%
9%
5%
6%
7%
mean
0%
2%
5%
8%
14%
21%
SEM
0%
1%
2%
2%
3%
5%
